The sine function outputs the y-coordinate of a point on the unit circle corresponding to a given angle. It is defined as f(x) = sin(x).
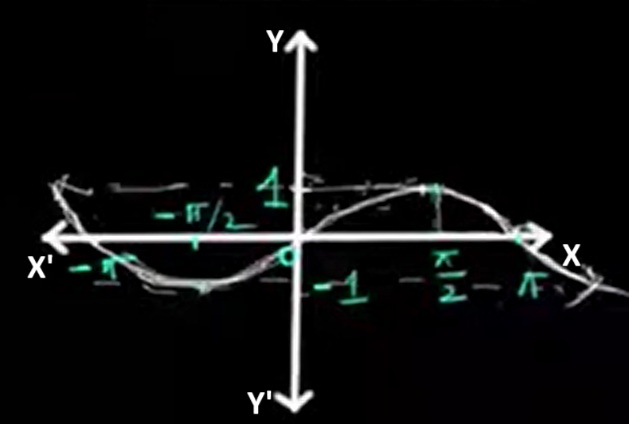
The sine graph is a smooth, continuous wave that oscillates between -1 and 1. It starts at the origin (0,0), rises to 1 at π/2, returns to 0 at π, goes to -1 at 3π/2, and completes one full cycle at 2π.
Sine is a continuous function that accepts all real values as input. Domain: (-∞, ∞)
The cosine function only produces values from -1 to 1. Range: [-1, 1]
The cosine function gives the x-coordinate of a point on the unit circle at a given angle. It is written as f(x) = cos(x).
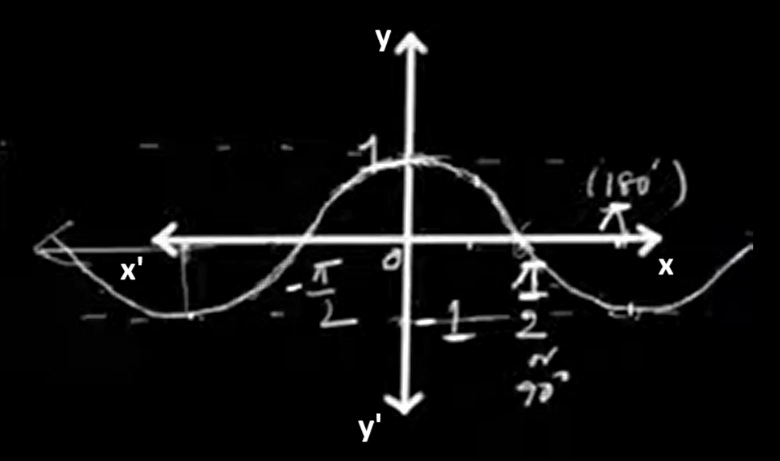
Like the sine graph, the cosine graph is also wave-like and oscillates between -1 and 1. However, it starts at its maximum value, 1, at x = 0. It reaches 0 at π/2, -1 at π, back to 0 at 3π/2, and returns to 1 at 2π.
The cosine function has a domain that includes all real values. Domain: (-∞, ∞)
The values range between -1 and 1. Range: [-1, 1]
The tangent function is the ratio of sine to cosine: f(x) = tan(x) = sin(x) / cos(x). It measures the slope of the angle's terminal side on the unit circle.
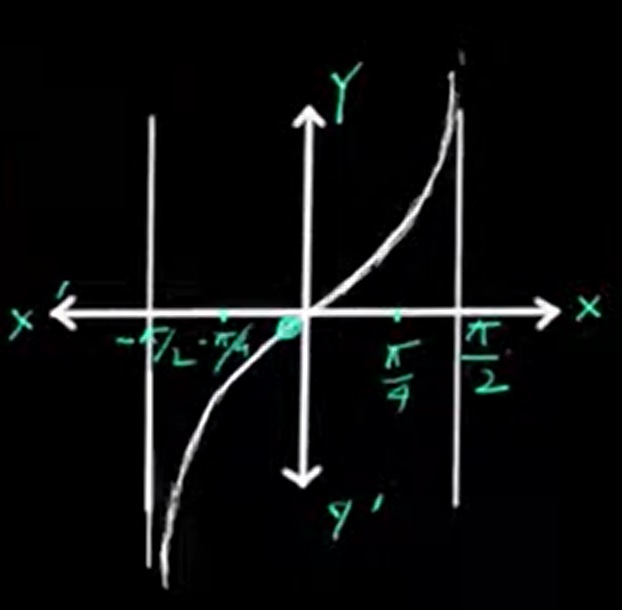
The graph of the tangent function includes vertical asymptotes that occur repeatedly wherever the cosine value equals zero, such as at odd multiples of π/2. It increases steeply between these asymptotes and has no maximum or minimum value.
The tangent function is undefined at x = ±π/2, ±3π/2, etc. Domain: x ≠ (2n+1)π/2, where n is an integer
Unlike sine and cosine, the tangent function can take any real value. Range: (-∞, ∞)
Understanding the graphical behavior of sine, cosine, and tangent functions is essential in trigonometry. While sine and cosine show smooth, periodic waveforms with a limited range, the tangent graph behaves differently with steep curves and vertical asymptotes. Recognizing these patterns helps in analyzing trigonometric relationships and solving equations more effectively.
 Facebook
 Twitter
 Linkedin