The square root function is defined as: f(x) = √x.
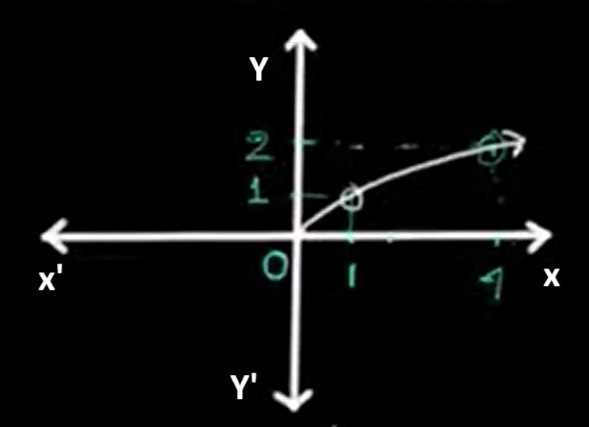
The graph of f(x) = √x begins at the point (0, 0) and rises gradually as x increases. It is a curve that lies entirely in the first quadrant.
The square root function is defined only for non-negative real inputs: x ≥ 0 or [0, ∞).
Its output values are limited to non-negative real numbers only: f(x) ≥ 0 or [0, ∞).
The reciprocal function is defined as: f(x) = 1/x.
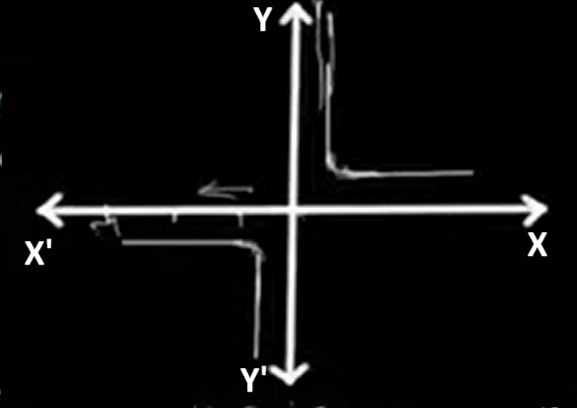
The graph of f(x) = 1/x is a hyperbola with two branches, one in the first quadrant and one in the third. The graph approaches the x-axis and y-axis but never crosses them, as they act as asymptotes.
The domain includes all real numbers except 0: x ≠ 0 or (-∞, 0) ∪ (0, ∞).
The range also excludes 0: f(x) ≠ 0 or (-∞, 0) ∪ (0, ∞).
 Facebook
 Twitter
 Linkedin